Data Display
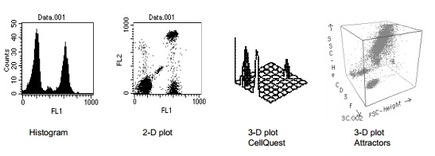
For data display four types of data sets are possible, although the 2D plots and histograms are the most commonly applied. The surface plots and tomogram are less common.
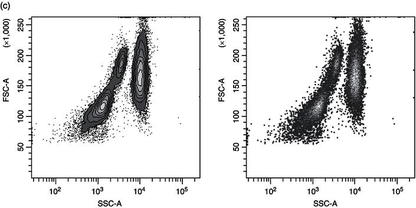
For bivariable (FSCvsSSC) The Counter plot and the Density plot are used.
For bivariable (FSCvsSSC) The Counter plot and the Density plot are used.
Dot Plots
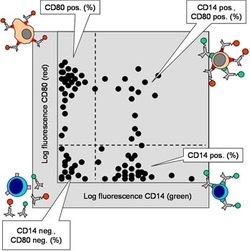
Each dot represents a cell or particle. The stronger the signal the further along each scale the data is displayed. The FSC vs SSC plot is a frequently used dot plot for peripheral blood analysis and subsequent gating.
Divides in four Quadrants:
Divides in four Quadrants:
- Q1 the double negative;
- Q2 the single positive for FSC;
- Q3 the double positive;
- Q4 the single positive for SSC.
Gating
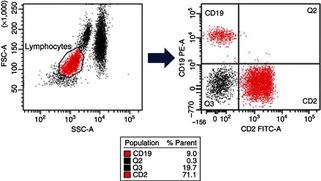
Gating refers to the ability to isolate single populations of interest within a heterogeneous sample. As flow cytometers are capable of analysing thousands of cells per second, gating allows analysis to be restricted to a subpopulation of cells without having to isolate them from a mixed sample prior to analysis.
Fig. Leach, M., Drummond, M., and Doig, A. (2013) Pratical Flow Cytometry in Haematology Diagnosis. John Wiley & Sons, Ltd.
www.antibodies-online.com
Reference:Leach, M., Drummond, M., and Doig, A. (2013) Pratical Flow Cytometry in Haematology Diagnosis. John Wiley & Sons, Ltd.
http://www.stemcell.umn.edu/prod/groups/med/@pub/@med/documents/asset/med_80691.pdf
